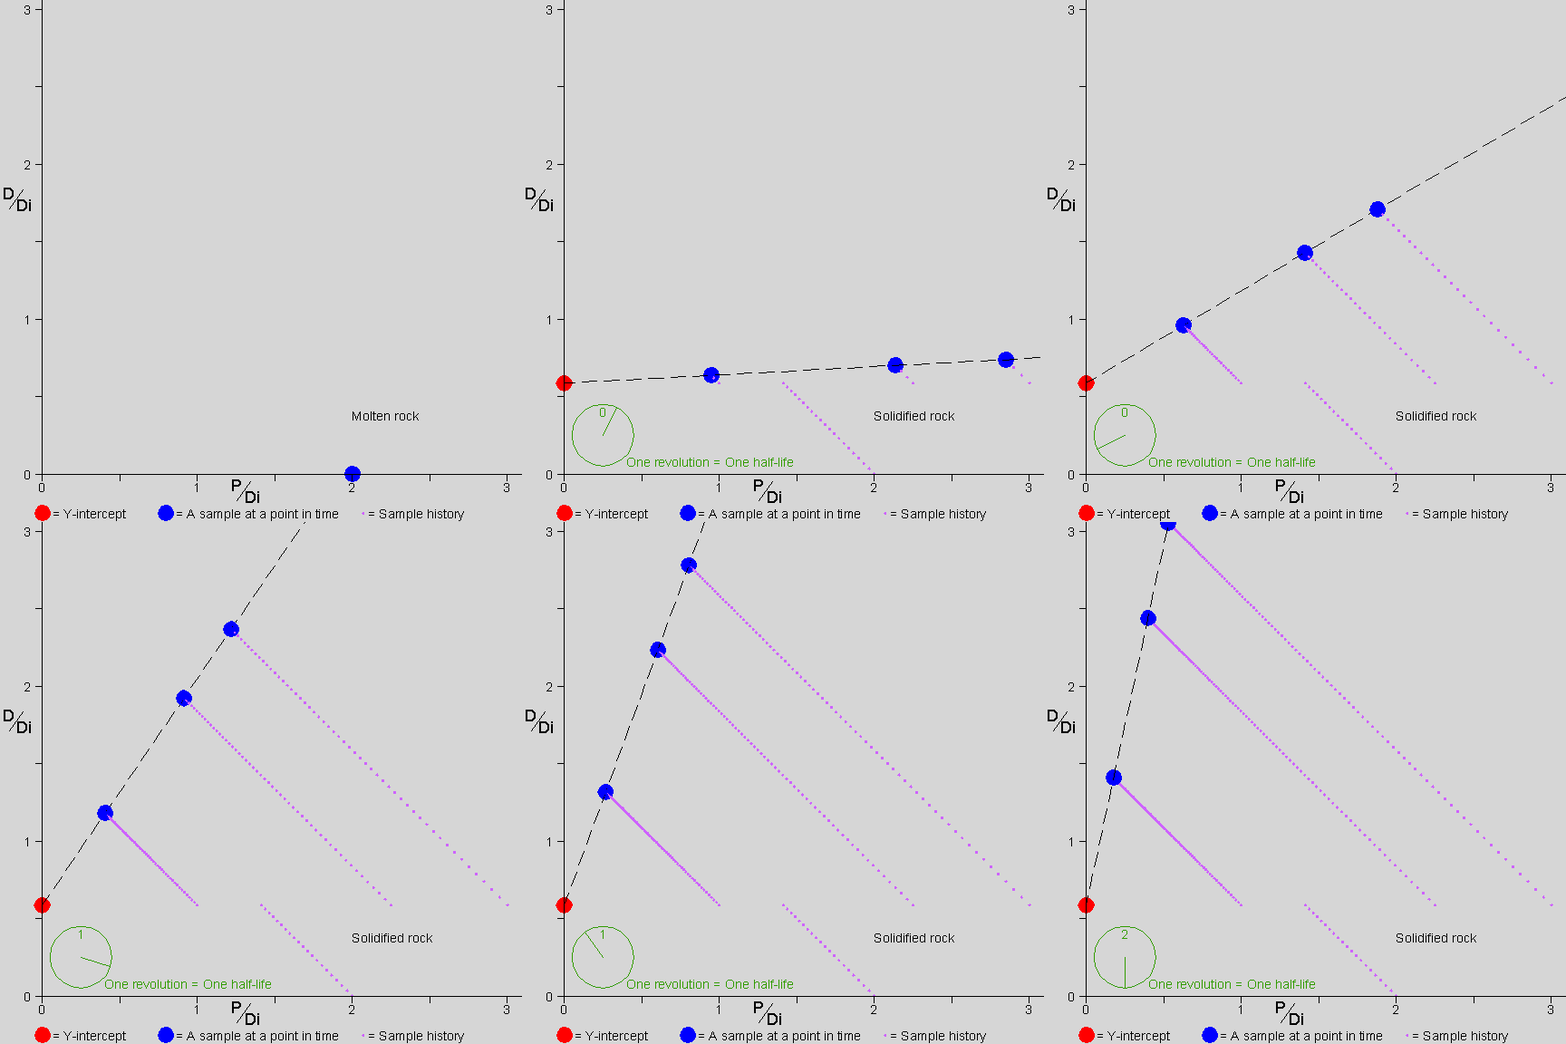
Watching a Rock Age on an Isochron Diagram
by Jon Fleming![]()

![]()

![]() he picture shows a rock forming
and aging, over a
period of three half-lives, as you would see it on an
isochron diagram. The frame rate should be constant, but it
may not be on your system.
he picture shows a rock forming
and aging, over a
period of three half-lives, as you would see it on an
isochron diagram. The frame rate should be constant, but it
may not be on your system.
During the first 1/2 half-life the rock is molten. P decays to D, but the atoms are mobile in the molten rock. The P and D mix evenly throughout the rock. Any sample taken from the rock has the same amount of P and D. Since there is only one data point on the graph during the molten time, there is no isochron line (because one point does not define a line).
At the end of the first 1/2 half-life, the rock solidifies. This rock happens to solidify into three minerals that take up different amounts of P and D (and Di). Now those three minerals plot as three distinct points and define an isochron line. The line through them is initially horizontal, because the solidification process does not distinguish between D and Di; therefore, the ratio of D to Di in each sample is the same at solidification.
For the rest of the time shown, 2.5 half-lives, the P in each mineral continues to decay into D. The atoms are not mobile and remain where they are. In each mineral, the amount of P decreases (so the point representing that mineral moves to the left) and the amount of D increases in proportion to the decrease in P (so the point representing that mineral also moves up).
Note that the Y-intercept of the isochron line is always at the value of D/Di that was present in all the samples at solidification.
The stopwatch at the bottom left shows the passing of time. Note that for each slope of the isochron line there is a unique amount of time that has passed since solidification. By measuring the slope of the isochron line, we find the amount of time that has passed since solidification.
More information may be found at Chris Stassen's Isochron Dating FAQ

Home Page | Browse | Search | Feedback | Links
The FAQ | Must-Read Files | Index | Creationism | Evolution | Age of the Earth |
Flood Geology | Catastrophism |
Debates