
Isochron Dating
by Chris Stassen![]()

![]()
The simplest form of isotopic age computation involves substituting three measurements into an equation of four variables, and solving for the fourth. The equation is the one which describes radioactive decay:

The variables in the equation are:
Solving the equation for "age," and incorporating the computation of the original quantity of parent isotope, we get:
![age = halflife * log2( 1 + { D[now] / P[now] } )](/faqs/isochron-dating/equatn-2.gif)
Some assumptions have been made in the discussion of generic dating, for the sake of keeping the computation simple. Such assumptions will not always be accurate in the real world. These include:
If one of these assumptions has been violated, the simple computation above yields an incorrect age.
Note that the mere existence of these assumptions do not render the simpler dating methods entirely useless. In many cases, there are independent cues (such as geologic setting or the chemistry of the specimen) which can suggest that such assumptions are entirely reasonable. However, the methods must be used with care -- and one should be cautious about investing much confidence in the resulting age... especially in absence of cross-checks by different methods, or if presented without sufficient information to judge the context in which it was obtained.
Isochron methods avoid the problems which can potentially result from both of the above assumptions.
Isochron dating requires a fourth measurement to be taken, which is the amount of a
different isotope of the same element as the daughter product of radioactive decay. (For
brevity's sake, hereafter I will refer to the parent isotope as P, the
daughter isotope as D, and the non-radiogenic isotope of the same element as
the daughter, as Di). In addition, it requires that these
measurements be taken from several different objects which all formed at the same time from a
common pool of materials. (Rocks which include several different minerals are excellent for
this.)
Each group of measurements is plotted as a data point on a graph. The X-axis of the graph is
the ratio of P to Di. The Y-axis of the graph
is the ratio of D to Di. For example, an Rb/Sr
isochron plot looks like this:
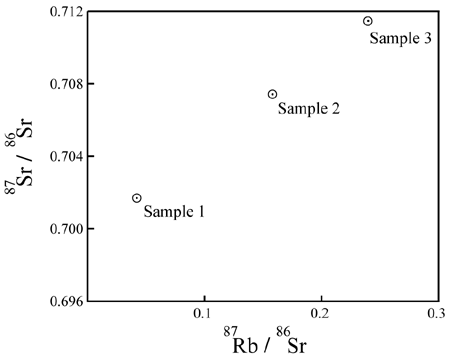
P = 87Rb;
D = 87Sr; Di
= 86Sr.What does it mean?
The intent of the plot is to assess a correlation between:
P (X-value of the data points), andD (Y-value of the data points):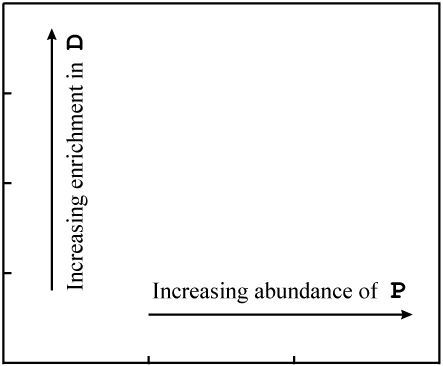
If the data points on the plot are colinear, and the line has a positive slope, it shows an extremely strong correlation between:
P in each sample, andD, relative to
Di.This is a necessary and expected consequence, if the additional D is a
product of the decay of P in a closed system over time. It is not easily
explained, in the general case, in any other way.
The data points would be expected to start out on a line if certain initial conditions were met. Consider some molten rock in which isotopes and elements are distributed in a reasonably homogeneous manner. Its composition would be represented as a single point on the isochron plot:
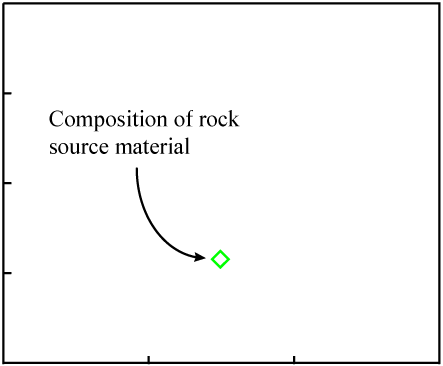
As the rock cools, minerals form. They "choose" atoms for inclusion by their chemical properties.
Since D and Di are isotopes of the same
element, they have identical chemical properties*.
Minerals may include varying quantities of that element, but all will inherit the same
D/Di ratio as the source material. This results in an identical
Y-value for the data points representing each mineral (matching the Y-value of the source
material).
* Note that the above is somewhat simplified. There are minor differences between isotopes of the same element, and in relatively rare circumstances it is possible to obtain some amount of differentiation between them. This is known as isotope fractionation. The effect is almost always a very small departure from homogeneous distribution of the isotopes -- perhaps enough to introduce an error of 0.002 half-lives in a non-isochron age. (It can happen... but it is rare and the effect is not large enough to account for extremely old ages on supposedly young formations.)
In contrast, P is a different element with different chemical properties.
It will therefore be distributed unequally relative to D &
Di as minerals form. This results in a range of X-values for the
data points representing individual minerals.
Since the data points have the same Y-value and a range of X-values, they initially fall on a horizontal line:
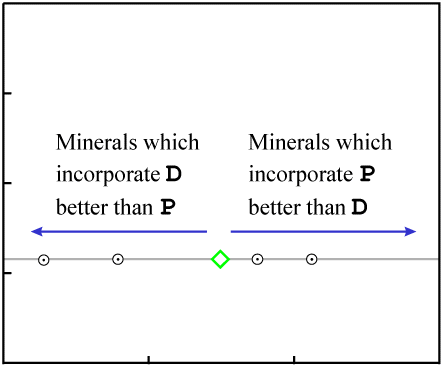
A horizontal line represents "zero age." *
* More precisely, a horizontal line
represents an age which is indistinguishable from zero. In most cases, any age less than about
10-3 P half-lives will include zero within
its range of uncertainty. (The range of uncertainty varies, and may be as much as an order of
magnitude different from the approximate value above. It depends on the accuracy of the
measurements and the fit of the data to the line in each individual case.) For example, with
Rb/Sr isochron dating, any age less than a few tens of millions of years is usually
indistinguishable from zero. That encompasses the entire young-Earth timescale thousands of times
over.
As more time passes and a significant amount of radioactive decay occurs, the quantity of
P decreases by a noticeable amount in each sample, while the quantity of
D increases by the same amount. This results in a movement of the data points
to the left (decreasing P) and upwards (increasing D).
Since each atom of P decays to one atom of D, the data
point for each sample will move along a path with a slope of -1.
Decay occurs in a proportional manner (that is, when 20% of the P in one
sample has decayed, 20% of the P in every sample will have decayed).
As a result, the data points with the most P (the right-most ones on the
plot) move the greatest distance per unit time. The data points remain colinear as time passes,
but the slope of the line increases:
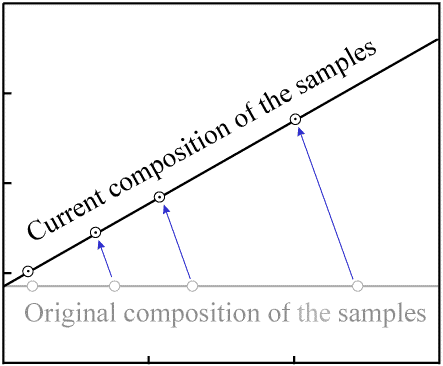 Figure 5. Movement of data points as decay occurs. |
|
The slope of the line is the ratio of enriched D to remaining
P. It can be used in place of "Dnow/Pnow"
in the decay equation.
Age "uncertainty"
When a "simple" dating method is performed, the result is a single number. There is no good way to tell how close the computed result is likely to be to the actual age.
An additional nice feature of isochron ages is that an "uncertainty" in the age is automatically computed from the fit of the data to a line. A routine statistical operation on the set of data yields both a slope of the best-fit line (an age) and a variance in the slope (an uncertainty in the age). The better the fit of the data to the line, the lower the uncertainty.
For further information on fitting of lines to data (also known as regression analysis), see:
Note that the methods used by isotope geologists (as described by York) are much more complicated than those described by Gonick. This will be discussed in more detail in the section on Gill's paper below. The "generic" method described by Gonick is easier to understand, but it does not handle such necessities as: (1) varying levels of uncertainty in the X- versus Y-measurements of the data; (2) computing an uncertainty in slope and Y-intercept from the data; and (3) testing whether the "fit" of the data to the line is good enough to imply that the isochron yields a valid age. Unfortunately, one must wade through some hefty math in order to understand the procedures used to fit isochron lines to data.
General comments on "dating assumptions"
All radiometric dating methods require, in order to produce accurate ages, certain initial conditions and lack of contamination over time. The wonderful property of isochron methods is: if one of these requirements is violated, it is nearly certain that the data will indicate the problem by failure to plot on a line. (This topic will be discussed in much more detail below.) Where the simple methods will produce an incorrect age, isochron methods will generally indicate the unsuitability of the object for dating.
Now that the mechanics of plotting an isochron have been described, we will discuss the potential problems of the "simple" dating method with respect to isochron methods.
The amount of initial D is not required or assumed to be zero. The greater
the initial D-to-Di ratio, the further the
initial horizontal line sits above the X-axis. But the computed age is not affected.
If one of the samples happened to contain no P (it would plot where the
isochron line intercepts the Y-axis), then its quantity of D wouldn't change
over time -- because it would have no parent atoms to produce daughter atoms. Whether there's a
data point on the Y-axis or not, the Y-intercept of the line doesn't change as the slope of the
isochron line does (as shown in Figure 5). Therefore, the Y-intercept of
the isochron line gives the initial global ratio of D to
Di.
For each sample, it would be possible to measure the amount of the
Di, and (using the ratio identified by the Y-intercept of the
isochron plot) calculate the amount of D that was present when the sample
formed. That quantity of D could be subtracted out of each sample, and it
would then be possible to derive a simple age (by the equation introduced in the first section of
this document) for each sample. Each such age would match the result given by the isochron.
Gain or loss of P changes the X-values of the data points:
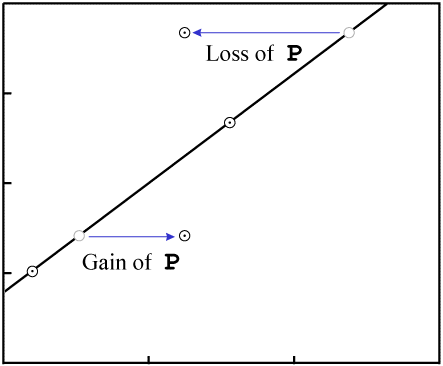
P.In order to make the figures easy to read (and quick to draw), the examples in this paper include few data points. While isochrons are performed with that few data points, the best ones include a larger quantity of data. If the isochron line has a distinctly non-zero slope, and a fairly large number of data points, the nearly inevitable result of contamination (failure of the system to remain closed) will be that the fit of the data to a line will be destroyed.
For example, consider an event which removes P. The data points will tend
to move varying distances, for the different minerals will have varying resistance to loss of
P, as well as varying levels of Di:
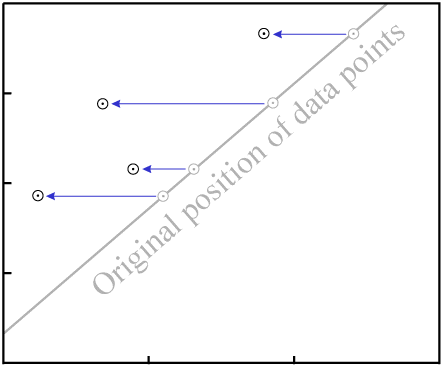
P in all samplesThe end result is that the data are nearly certain not to remain colinear:
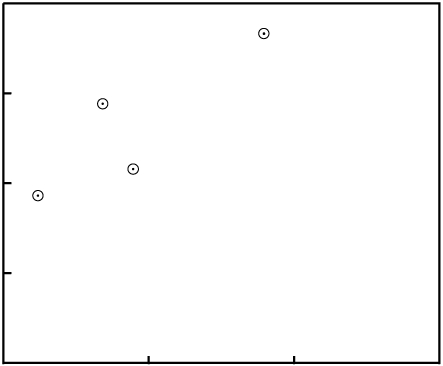
P destroys the fit to a
line.Even in our simple four-data-point example isochron, a change to two of the samples...
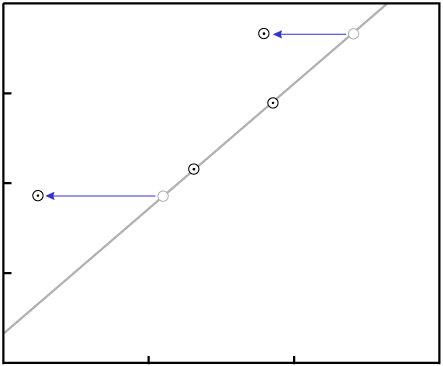
... would require exact changes to the remaining two samples in order for the data to remain colinear:
Note: In the special case where the isochron line has a zero slope (indicating zero age), then
gain or loss of P may move the data points, but they will all still fall on
the same horizontal line. In other words, random gain or loss of P does
not affect a zero-age isochron. This is an important point. If the Earth were as young as
young-Earth creationists insist, then the "contamination" which they suggest to invalidate dating
methods would have no noticeable effect on the results.
In the case of Rb/Sr isochron dating, the most common form of isotope migration is a preferential loss of radiogenic daughter (87Sr). Faure (1986, p. 123) notes:
Moreover, the daughter atoms produced by decay in a mineral are isotopes of different elements and have different ionic charges and radii compared with their parents. The energy released during the decay may produce dislocations or even destroy the crystal lattice locally, thus making it all the more easy for the radiogenic daughters to escape.
[...]
The observed behavior of the minerals can generally be treated as though it had been caused solely by the migration of radiogenic 87Sr among the constituent minerals of a rock.
This will change the vertical position of the data points:
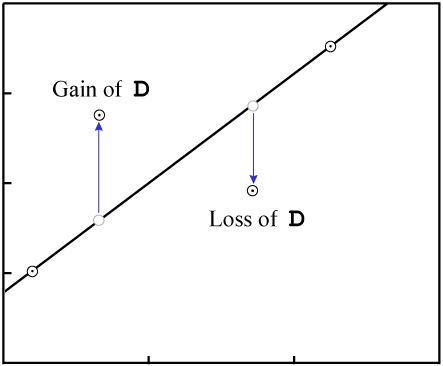
D.As with gain or loss of P, in the general case it is highly unlikely that
the result will be an isochron with colinear data points:
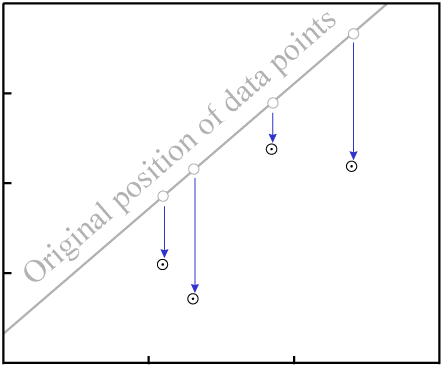
D destroys fit to an
isochron.There are two exceptions, where it is possible for migration of D to
result in an isochron with reasonably colinear data points:
D is completely homogenized, then the isochron age is reset to
zero. When this happens, any later dating attempt will yield the age of that metamorphic event
rather than the original time of crystallization:D is partially homogenized in a reasonably regular manner, the
isochron age can be partially reset and the samples will date to sometime in between the original
time of crystallization and the time of metamorphism. This is a very rare occurrence, but
examples are known:These exceptions should be of little comfort to young-Earthers, for (1) they are uncommon (extremely uncommon in the case of partial resetting); and (2) the result in both cases is an isochron age which is too young to represent the time of formation. Young-Earthers necessarily insist that all ancient isochron ages are really much too old.
In the real world, nothing is perfect. There are some isochron results which are obviously incorrect. The significance of isochron plots is a bit counter-intuitive in some cases. And there are known processes which can yield an incorrect isochron age. Does this leave room to discard isochron dating as entirely unreliable? Not really...
Next we shall examine in detail some specific examples.
One of the requirements for isochron dating is that the samples be cogenetic, meaning that they all formed at about the same time from a common pool of material in which the relevant elements and isotopes were distributed reasonably homogeneously. (As described in Figure 4, this is how the data are caused to be colinear.)
Usually it is easy to determine whether or not this requirement is met. The check is not just the isochron plot itself (which can in most cases indicate such a problem by failure of the data to fall on a line), but in addition the physical location and geological relationships of the samples selected for dating.
If this requirement is violated, it is sometimes still possible to obtain an isochron plot with reasonably colinear data points. The significance of the computed age, however, will likely not be the last time of crystallization of each sample. It might instead be the original time at which the samples became separated from a common pool of matter, or the age of that source material itself. The resulting age is meaningful, but it does not have the meaning which one might expect for the dating result (i.e., time of crystallization of the dated sample itself).
Consider an old body of rock (as evidenced by its good fit to an isochron with distinctly
non-zero slope) with minerals which melt at different temperatures. In this example, the minerals
with the lowest melting-point having the lowest
P-to-Di and
D-to-Di ratios:
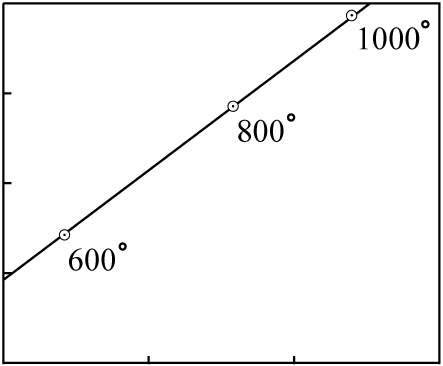
The rock is heated slowly, and at various times the molten portions are moved to the surface in a series of lava flows. The earliest flows will have an isotopic composition close to that of the minerals with the lowest melting points; the latest flows will have an isotopic composition close to that of the minerals with the highest melting points.
The individual lava flows are not cogenetic. They did not separate at about the same time from an isotopically homogeneous pool of matter.
For the sake of simplicity, we will assume three lava flows each with a composition matching the data points of the previous figure:
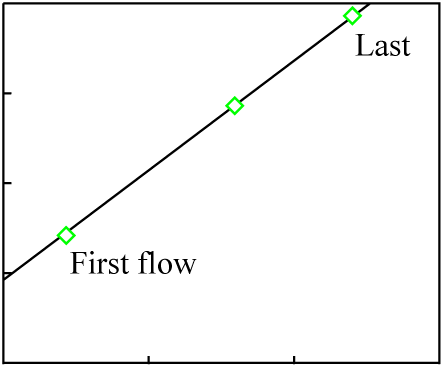
It is likely that at least a small amount chemical differentiation will have occurred in each melt, and that as a result the minerals of each individual lava flow will exhibit a much younger isochron (the actual age of each flow):
The data points for the overall composition of each flow fall on an isochron line representing the original crystallization time of the source material, which is much greater than the age of any of the flows. This sort of inherited age is well-understood, discussed thoroughly in the literature, and usually easily avoided by proper selection of samples.
Note also that chemical differentiation at the time of the latest melting (resulting in the round data points in Figure 17) induces significant scatter into the isochron plot if any measure other than whole-rock is made:
It is also possible to obtain an isochron with colinear data, whose age has no significance whatsoever. The only reasonably common way is by mixing of materials.
Consider two entirely independent sources of material, A and
B, each with a different isotopic composition:
|
|
|||||
| Source material |
P(ppm) |
D(ppm) |
Di(ppm) |
P |
D |
|
|
|||||
A |
18 | 37 | 39 | 0.462 | 0.949 |
B |
10 | 17 | 11 | 0.909 | 1.545 |
|
|
|||||
Each could be plotted as a data point on an isochron diagram:
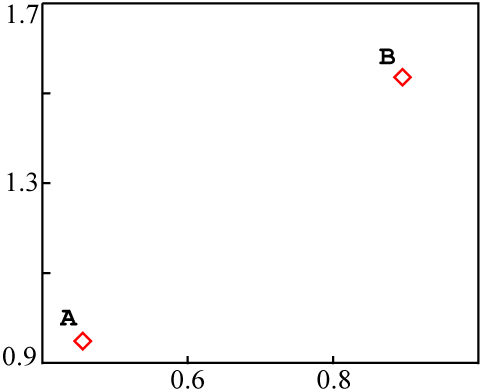
If these sources were mixed together into a single rock, in such a way that the different
samples of the rock ended up with different proportions of A and
B, without chemical differentiation, the end result would be something like
this:
|
|
|||||
| Sample source |
P(ppm) |
D(ppm) |
Di(ppm) |
P |
D |
|
|
|||||
A |
18 | 37 | 39 | 0.462 | 0.949 |
¾ A + ¼ B |
16 | 32 | 32 | 0.500 | 1.000 |
½ A + ½ B |
14 | 27 | 25 | 0.519 | 1.080 |
¼ A + ¾ B |
12 | 22 | 18 | 0.667 | 1.222 |
B |
10 | 17 | 11 | 0.909 | 1.545 |
|
|
|||||
A and
B in each.When plotted on an isochron diagram, the mixed data points are all colinear with
A and B:
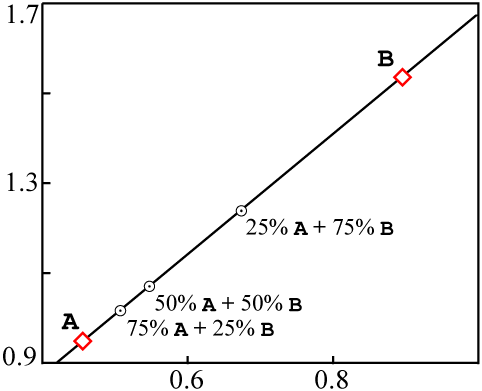
Mixing would appear to be a pernicious problem. Since A and
B can be completely unrelated to each other, their individual compositions
could plot to a fairly wide range of locations on the graph. The line
AB could have any slope at all.
That fact also allows us to make a rough estimate of the percentage of isochrons that give colinear plots due to mixing. "Meaningful" (or "valid") isochrons must have a zero or positive slope; "mixing" isochrons can have any slope. If isochrons of negative slope (which must be mixing lines) were reasonably common, then we might suspect mixing to be an explanation for a significant fraction of all apparently valid "old" isochrons as well. That is not the case, however.
In addition, there is a relatively simple test which can detect mixing in most cases. The test
is a plot with the same Y-axis as the isochron plot, but an X-axis of the reciprocal of total
daughter element (D + Di).
For the sample data used above, the plotted values would be:
|
|
||||||
| Sample source |
P(ppm) |
D(ppm) |
Di(ppm) |
1(ppm-1) |
D |
|
|
|
||||||
A |
18 | 37 | 39 | 0.0132 | 0.949 | |
¾ A + ¼ B |
16 | 32 | 32 | 0.0156 | 1.000 | |
½ A + ½ B |
14 | 27 | 25 | 0.0192 | 1.080 | |
¼ A + ¾ B |
12 | 22 | 18 | 0.0250 | 1.222 | |
B |
10 | 17 | 11 | 0.0357 | 1.545 | |
|
|
||||||
The resulting mixing plot looks like this:
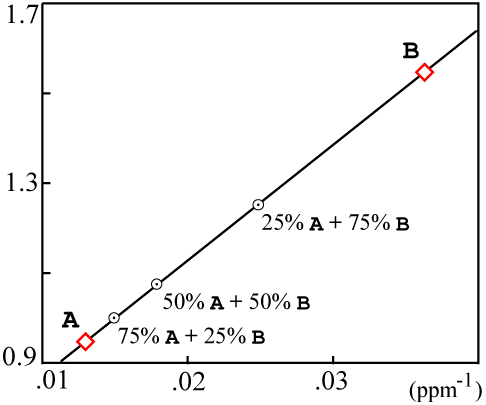
If the resulting data points are colinear, then the isochron is likely a result of mixing and probably has no real age significance.
Actually the mixing data can fall on a somewhat more complicated curve. Faure (1986, Equations 9.5 through 9.10 on p. 142) contains a precise derivation. There are simplifying assumptions which are true in most cases and yield a line on the mixing plot.
However, when the mixing plot data fail to fall on a line:
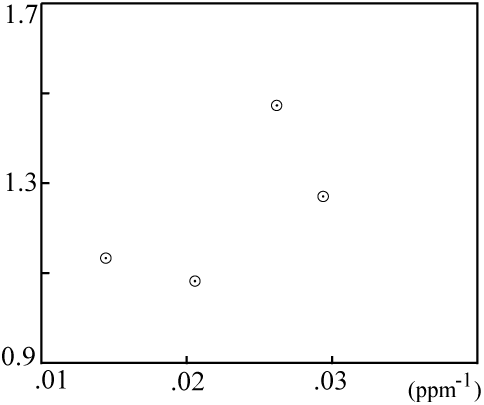
... then the isochron is probably not a result of mixing, and the computed age is very likely meaningful.
Lately it seems that some creationists have latched onto Zheng (1989), and reference this paper as if it disproved isochron dating and made room for a young Earth. The paper is a discussion of potential problems of Rb/Sr isochron dating, with examples of instances where these problems are known to have occurred.
However, the paper is not terribly helpful to the young-Earth cause. Zheng discusses four ways in which an incorrect isochron could result:
While each of these processes can be invoked to explain a few confusing or conflicting dating results, none could reasonably be expected to account for all (or even most) isochron dating results which are incompatible with a young Earth.
There are known processes which can result in incorrect isochron ages, and examples of each are known in the field. If one were to assume that a good-fitting isochron implies a reliable result, one would be correct approximately nine times out of ten. However, accuracy can be improved further with...
As Brent Dalrymple said:
Most [inaccurate ages] are caught by appropriate safeguards, like standards and repetition, but some go unrecognized until long after the data have been published. In short, radiometric dating methods give reliable results most of the time, but not always.
[...]
With sufficient cross checks, care and experience, we don't really get fooled very often and when we do it is usually not for long.
(1992, p. 1)
Recently Gill (1996) has published in the creationist technical literature, claiming that all Rb-Sr isochron ages can be explained away as meaningless "false" correlations. The abstract reads:
A mathematical answer is presented for the frequent occurrence of false of "fictious" Rb-Sr isochrons. The reason for these inconsistencies is that a simple linear regression procedure is mathematically invalid if two or more independent variables influence a single dependent variable. In many data sets for the "isochron" procedure, there are two independent variables involved. First, there is the desired radioactive relation between the amount of the rubidium parent and the strontium daughter. Second, since the atomic strontium concentration in the samples is a variable, then the isotopic Sr-87 content of the atom [sic] is also a variable. In such a situation, the "Isochron" regression is mathematically invalid, so both its slope and intercept are erroneous.
I recommend that interested parties obtain and read this paper. I see four major problems with the creationist claims -- sufficient to invalidate the creationist paper rather than (as Gill desires) the Rb-Sr dating procedure.
1. Mathematics versus chemistry:
The behavior of isochron data is constrained in two ways -- both by what is mathematically possible on the plot, as well as by what is physically possible given the chemistry of the relevant elements. Gill's theoretical treatment concentrates solely on mathematical behavior, while ignoring the underlying chemistry. It therefore runs the risk of reaching false conclusions by assuming behaviors which are mathematically possible -- but chemically unlikely or impossible.
Gill's paper does make this sort of bad assumption: that 86Sr and 87Sr concentrations are essentially independent:
No such simple relationship exists when the divisor [86Sr]is a variable.
[...]
Once the division by a variable is done for the input to the regression, the error is unpredictable and irrevocable.
That is the linchpin of Gill's argument. If that assumption is not accurate, then Gill's argument falls apart. As discussed earlier in this FAQ, isotopic homogenization occurs in molten rock (and even at temperatures short of melting in many cases) where the relevant elements migrate freely. Once homogenization has occurred, the quantities of 86Sr and 87Sr are no longer independent and cannot be made so.
2. Percentage of problematic Rb-Sr ages:
Gill suggests that a large percentage of Rb-Sr isochron ages are incorrect even from mainstream science's point of view:
The geological literature is filled with references to Rb-Sr isochron ages that are questionable, and even impossible. Woodmorappe (1979, pp. 125-129) cites about 65 references to the problem. Fause (1977, pp. 97-105) devotes his chapter seven to possible causes of "fictitious" isochrons. Zheng (1989, pp. 15-16) also cites 42 references.
Gill's allegations are untrue. False isochrons due to mixing may be somewhat common (incidentally, that is the real topic of Faure's chapter seven). However, these can be (as discussed in the mixing section of this FAQ) detected easily and eliminated from consideration. Of the remainder, however, the overwhelming majority are well-aligned with the results that would be expected given the mainstream age and history of the Earth.
A very large number of Rb/Sr isochrons have been performed. We cannot be impressed by numbers of supposed bad dates in the low tens; they represent a tiny fraction of the reported results, and (in both creationist and non-creationist papers on potential problems with the method) represent only the "anomalous" values collected from a much larger body of data. Some of the papers include obvious cases of mixing as well as cases where the data set is too small or too ill-fitting to be taken seriously.
In order to perform a reasonable assessment of the percentage of Rb-Sr isochron ages which are "inconvenient" to mainstream science, we would count those which: (1) do not fail the test for mixing, (2) include more than four data points, and (3) show an excellent correlation (say, an age uncertainty of less than 0.1Ga is computed from the data). It would be impractical to attempt such an exercise on all of the Rb-Sr isochron ages that have ever been reported. However, it is quite possible to fully examine the literature of some sub-set of the data.
Brent Dalrymple (1991, Chapters 5 and 6) reports a large number of Rb-Sr isochron ages for meteorites and Moon rocks. These are fairly good candidates for such a survey, because: (1) they tend to have geologically simple histories, and therefore the interpretation of the results is more straightforward; (2) there aren't large quantities of these objects to be dated (this makes a survey of the data easier, and also eliminates the common creationist claim that there might be a much larger number of "inconvenient" results that are not published).
3. Gill's example is contrived:
Much of Gill's paper discusses a single example, which is contrived. He translates four colinear data points in such a a way that the leftmost two are crowded down 3/4 of the way towards the origin, and the rightmost two are crowded down 1/2 of the way towards the origin.
The result is essentially two "groups" of data (the point of a pair are moved closer together by Gill's translation). Since any two things will be colinear, the two groups are colinear. Since the data points in each group are fairly close to each other, there's not much scatter about the line. However, had Gill chosen to divide the first and last points by four (instead of the first two), or chosen four different divisors, the fit to a line of his changed would be much worse than the original fit.
4. Gill ignores the isochron assessment techniques actually in use:
Gill's simple linear regressions are not the exact the technique used to assess isochron fits. There are fairly complex means of assessing the fit versus the expected errors of measurement; even when ("by eye") the data appear to be fairly colinear, it does not mean that the procedure will indicate a likely valid isochron.
It's difficult to assess Gill's own example as if it were realistic, because his values are not real isotope measurements and are just pulled out of thin air. While a correlation of 0.993 may sound impressive, several example isochron diagrams pulled out of the technical literature had much better fits (0.997 to 0.998).
The following are interesting questions that were asked in talk.origins about isochron dating. The names of the "questioners" have not been included because permission to use their names has not been obtained.
For the Rb/Sr isochron method, the ratio of 87Sr to 86Sr at time of formation is not needed as an input to the equation. Instead, it is given by the Y-intercept of the isochron line. It is a by-product of the age computation... provided that the data are colinear.
An "isochron" is a set of data points in a plot which all fall on a line representing a single age ("isochron" comes from: "isos" equal + "chronos" time). The term "errorchron" has been coined for a set of data which are not colinear. The best-fit line itself is also sometimes called an "isochron." The plot on which these data points appear is sometimes called an "isochron diagram" or "isochron plot."
A dating method which uses such a plot to determine age is called an "isochron dating method." When "isochron dating" is mentioned in this FAQ, the intent is to cover the methodology which is common to all "isochron dating methods."
Isochron methodology is applied with the following isotopes:
|
|
||||
P |
D |
Di |
half-life (*109 yr) | |
|
|
||||
| 87Rb | 87Sr | 86Sr | 48.8 | |
| 40K * | 40Ar | 36Ar | 1.25 | |
| 147Sm | 143Nd | 144Nd | 106 | |
| 176Lu | 176Hf | 177Hf | 35.9 | |
| 187Re | 187Os | 186Os | 43 | |
| 232Th * | 208Pb | 204Pb | 14 | |
| 238U * | 206Pb | 204Pb | 4.47 | |
|
|
||||
Table 4. Isotopes used for isochron dating
Half-life assessments don't necessarily take only "a few hours." Davis et al. (1977) measured the decay rate of 87Rb (48.9 ± 0.4 billion years) by counting the accumulation of 87Sr over a period of nineteen years.
The statistical uncertainty in an assessment of decay rate is a function of the number of decays counted. "A few hours" (on order of 10-15 half-lives of a long-lived isotope) is a relatively short span of time, but this is more than compensated by the fact that even a milligram of any relevant radioactive isotope contains at least 1018 atoms.
Even in a small sample of a long-lived isotope, there will be a constant stream of decays. If the sample's size can be measured accurately, and the number of decays can be counted accurately, then the half-life can be computed accurately. That's the basis for the "direct counting experiments" from which half-lives are calculated.
The assertion would be correct if the isochron plot were quantity of parent
(P) versus quantity of daughter (D). But the graph is
instead P/Di vs
D/Di. Since Di
will vary over different minerals, the isochron data can plot on a line when
P vs D would not.
It's easy to understand how different minerals in a rock could get different
P/Di ratios. P and
Di have different chemical properties. P will
fit better into some minerals than Di (and vice versa). This
explains why data points don't all fall on the same X-value.
However, it's less easy to understand how different minerals in a rock could end up with
different D/Di ratios. What the isochron plot
can discover, if the result is a good fit to a line with positive slope, is that there is an
extremely strong correlation between (1) enrichment in D, and (2) level of
P. Since D is produced from P by
radioactive decay, the correlation strongly suggests both (1) the age of the sample and
(2) that it has been relatively free of contamination since formation.
The situation which you describe wouldn't result in an age. If there were no chemical
separation of P vs (D and
Di) at time of formation, then all plotted data will fall on a
single point on the isochron diagram. (That point would initially be the composition of the
source material, as in Figure 3.) No best-fit line can be derived from a
single point and therefore no age would result.
It sounds as if you are suggesting that geologists might keep trying isochron plots on a single item until they get one where the data points line up, which probably isn't representative of its "real" age, and only that one gets published. (This is about one pace away from some pretty heavy-duty "conspiracy-theorizing.") Here are some reasons why I strongly doubt that this is done:
Outlying data points regularly reported, almost always plotted on the isochron diagram... but occasionally not included in the computation of the best-fit line. (However this is always made clear in the paper; exclusion of a small percentage of outliers is a reasonably standard statistical practice for improving accuracy of calculations.)
This is easily explained (indeed, required) if these methods yield accurate ages. How is it
explained if the "ages" are essentially random numbers? Suppose that the first researcher
publishes an age of X years. Do you think that the next person to study the
same formation is going to keep repeating the isochron method until obtaining isochron data that
both plot as a line and agree with the original researcher's work? It's not his problem if
the originally published age is incorrect.
An excellent semi-technical introduction to isotope dating methods (with an emphasis on isochron and Pb isotope dating) is available in Dalrymple (1991). I highly recommend this text. It is accessible to those who haven't studied the field, and has even received reasonably positive review in creationist literature. Isochron methods are introduced in a section titled "Age-Diagnostic Diagrams" (pp. 102-124).
For those who don't mind wading through a college-level textbook on isotope dating, I also highly recommend Faure (1986). It is the standard text on the entire field, and includes a large number of references to the primary literature. And, like Dalrymple's book, it has also received reasonably positive review in creationist literature. Isochron methods are first introduced in Chapter 6 (specifically pp. 72-74). More detailed treatment is given in Chapter 8, and Chapter 9 is an extended treatment on mixing.
Dalrymple, G. Brent, 1991. The Age of the
Earth. California: Stanford University Press, ISBN 0-8047-1569-6.
Back to the reference to this work
Dalrymple, G. Brent, 1992. Some Comments
and Observations on Steven Austin's "Grand Canyon Dating Project". Unpublished.
Back to the reference to this work
Davis, D.W., J. Gray, G.L. Cumming, and H. Baadsgard,
1977. "Determination of the 87Rb decay constant" in Geochim.
Cosmochim. Acta 41, pp. 1745-1749.
Back to the reference to this work
Faure, Gunter, 1986. Principles of Isotope
Geology (Second Edition). New York: John Wiley and Sons, ISBN 0-471-86412-9.
Back to contamination, questions, or further reading
Gill, G.H., 1996. "A Sufficient Reason for False Rb-Sr
Isochrons" in Creation Research Society Quarterly 33, pp. 105-108.
Back to the reference to this work
Gonick, Larry, 1993. The Cartoon Guide to
Statistics. New York: HarperPerennial, ISBN 0-06-273102-5.
Back to the reference to this work
York, Derek, 1969. "Least-squares fitting of a straight
line" in Canadian Journal of Physics 44, pp. 1079-1086.
Back to the reference to this work
Zheng, Y.-F., 1989. "Influences of the nature of the
initial Rb-Sr system on isochron validity" in Chemical Geology (Isotope Geoscience
Section) 80, pp. 1-16.
Back to the reference to this work

Home Page | Browse | Search | Feedback | Links
The FAQ | Must-Read Files | Index | Creationism | Evolution | Age of the Earth | Flood Geology | Catastrophism | Debates